In my practice, memory leaks in XAF application in 90% of cases occur by using undisposed IObjectSpace.
As is known in the XAF application all data operations are made through the session and IObjectSpace.
If you do not call the Dispose() method a large amount of memory will not be released. And after some time of using such a code your application grabs a huge amount of memory and this will adversely affect the performance and reliability of application.
Search for memory leaks is time consuming and requires highly skilled developer.
There is a standard approach to deal with such memory leaks by C# using keywords.
But in some cases the use of the using keyword is impossible. And fix memory leaks becomes very complex task.
To simplify this task Xafari Framework provides to developers a standard solution.
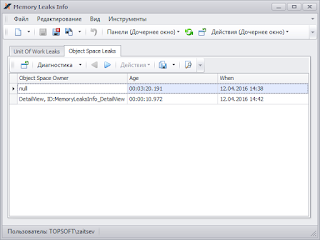
Xafari implements special Controller and Action to inspect all created and not released instances of UnitOfWorks and IObjectSpace. See picture below how to run report of active instances.
All active instances of UnitOfWork and IObjectSpace collected into 2 lists (see on picture). You can see information about Owner, Age and Time of creation.
I hope this article is usefull for you.
As is known in the XAF application all data operations are made through the session and IObjectSpace.
If you do not call the Dispose() method a large amount of memory will not be released. And after some time of using such a code your application grabs a huge amount of memory and this will adversely affect the performance and reliability of application.
Search for memory leaks is time consuming and requires highly skilled developer.
There is a standard approach to deal with such memory leaks by C# using keywords.
using (var objectSpace = Application.CreateObjectSpace())
{
}
But in some cases the use of the using keyword is impossible. And fix memory leaks becomes very complex task.
To simplify this task Xafari Framework provides to developers a standard solution.
Xafari implements special Controller and Action to inspect all created and not released instances of UnitOfWorks and IObjectSpace. See picture below how to run report of active instances.
All active instances of UnitOfWork and IObjectSpace collected into 2 lists (see on picture). You can see information about Owner, Age and Time of creation.
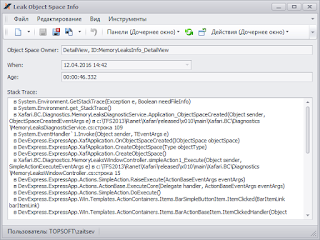
Detail information additionally contains the stack trace and serves to quick find source code line to fix memory leaks.
I hope this article is usefull for you.


No comments:
Post a Comment